



This week’s post is co-authored by Amelia Michael, research fellow at the Center for Technology and Statecraft and non resident fellow at the Foundation for American Innovation, and Karthik Tadepalli, research fellow at GovAI.

GDP estimates inform how the Fed sets interest rates, how the government determines fiscal policy, and the movement of bond and equity markets, among other things. These outputs that GDP feeds into—monetary policy, fiscal policy, and capital markets—rely on accurate aggregate GDP numbers, as well as accurate sectoral decompositions.
Moreover, future GDP growth has become a common yardstick for the transformative potential of AI. Anthropic’s recent economic scenarios argue that by 2030, US GDP could be up to 33% higher than it would be without AI. The Forecasting Research Institute surveyed economists and superforecasters about their estimates of future GDP growth as a way to forecast the economic impact of AI. Interpreting future GDP growth as evidence about AI’s impact requires confidence that those numbers will be accurate.
But AI could make GDP measurement less accurate. Much has been written about this issue, like the viral Citrini Research notion of “ghost GDP” or SemiAnalysis’s “dark output”. However, most writing on this topic doesn’t identify why AI will make GDP measurement hard: the reason AI will make GDP estimation difficult is because it’s hard to measure quality, which will lead to bad inflation estimates. As a result, AI will not affect the accuracy of nominal GDP estimates, but it will likely make real GDP estimates too conservative.
Context
The purpose of GDP measurement is to estimate how much stuff households consume, which we can then track over time. Unfortunately, “stuff” is not in comparable units; you can’t add a chair and a computer together, or say whether five chairs is more or less stuff than 2 computers. Instead, we estimate spending in each sector of the economy. For example, if $100 were spent on widgets in 2024 and $110 were spent on widgets in 2025, we’d estimate that widget consumption increased by 10%.
But that only works if the price of widgets stays constant. If the price of a widget increased by 10% from 2024 to 2025, that actually means widget consumption stayed the same. This is why we have to adjust for inflation to convert nominal GDP (which is just raw spending) to real GDP (which attempts to isolate the actual amount of stuff consumed).
Statistical agencies are meticulous about measuring prices. Each month, BLS collects prices for about 80,000 goods and services to construct indexes for 211 item categories in the CPI, which BEA then maps onto roughly 244 detailed PCE categories, each with its own deflator. All of this is specified in the 500-page NIPA handbook. (Just some light reading.) In short, a massive amount of work goes into estimating prices. Alas, estimating changes in prices is not enough to accurately track inflation, because you also need to estimate changes in quality.
People think of inflation as “prices going up.” But this isn’t quite right. In 2000, a Nokia phone cost around $150. Today, the latest iPhone costs $1,000. But it wouldn’t be reasonable to say that a phone today costs 600% more than a phone in 2000. Phones today have internet access, high-resolution cameras, GPS navigation, video calling, and much more. Plus, $150 today will buy you a Xiaomi Redmi 14C, which still has all of those advantages. By any reasonable standard, phones have far better value-for-money today than in 2000, so it would be wrong to say that there has been large inflation in the phone market. This pattern – prices increase, but quality also increases – means that statistical agencies have to adjust for the quality of new goods when calculating inflation.
Adjusting for quality is especially difficult when new features or new types of goods are introduced. We can think about quality measurement challenges as spanning a spectrum from gradual quality improvements to new goods. For example, cars could see a pure quality improvement (e.g. higher fuel efficiency), or a totally new product (e.g. self-driving cars), or a new feature that straddles the line (e.g. GPS navigation). In all cases, the new car is better than the old car in a way that needs to be accounted for.
Statistical agencies understand the importance of quality adjustment. Unfortunately, quality adjustment is hard, and by default, they don’t actually do it. The default approach to estimating inflation is the matched model comparison: BLS checks the price of the same item each month, and if that item stops being sold, a data collector picks the closest available replacement. If the replacement is considered essentially comparable, any price difference between it and its predecessor gets counted as pure inflation. In other words, quality doesn’t factor into the default method.
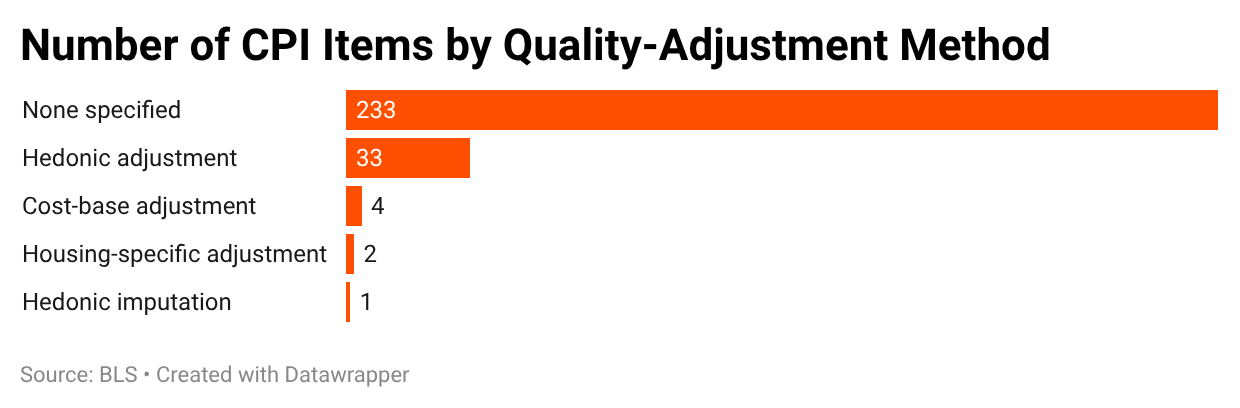
When statistical agencies do try to adjust for quality, the main methods rely on reducing goods to a list of measurable features. Hedonic quality adjustment involves putting a monetary value on each feature that a product can have, and subtracting the monetary value of a new product’s features from the observed price change. For smartphones, for example, the model prices features like screen resolution, processor speed, and cameras. So if a replacement phone has a faster processor, the estimated value of the extra speed is subtracted from the new phone’s price, before computing the price increase. Or see, for example, how BLS quality-adjusts men’s underwear using a 19-parameter regression on brand, style, fiber content, and multipack quantity.1
New products, meanwhile, are only accounted for when BLS rotates its samples or updates the basket, which happens with a lag – sometimes a long one. Cell phones were not classified separately in the CPI until 15 years after their introduction. This led BEA to underestimate real GDP growth, since cell phones were more expensive than landlines, but their quality gains were not accounted for.
AI could make quality mismeasurement worse
Quality mismeasurement is not a new problem, but AI could make it much worse.
First, AI’s quality increases are concentrated in services. Quality adjustment is hard enough for goods with defined characteristics, like cell phones and cars. But it is even harder for services, where there’s usually no identifiable quality that you can measure improvements along. There is no equivalent of “fuel efficiency” or “processor speed” that you can measure for legal services or therapy.
Most service price indexes therefore rely on the “matched-model” method discussed above, meaning the BLS just tracks what providers charge. AI might reduce the cost of services that have normally been tied to the hourly wages of white-collar workers – like accounting services, legal advice, therapy, career coaching, etc. – to close to zero, while also improving quality. If AI simultaneously reduces the price of a service and changes its quality, the agencies have no machinery for decomposing the two. Services are roughly two-thirds of consumer spending, so this could lead to significant errors.
Second, AI might lead to sector attribution errors. BEA maintains a detailed mapping from total spending to different sectors, creating a “deflator” for each sector – i.e. the price index that is used to deflate nominal GDP into real GDP. This system can capture price and quality changes within a category, but it is not designed to compare the emergence of substitutes in different categories.
If a household uses a general-purpose AI subscription instead of hiring a lawyer, BEA will record less spending on professional services and more on software or digital services. But neither the professional services deflator nor the software/digital services deflator directly compares the price of the human service with the AI-enabled substitute. If the AI delivers the same or better result at a lower cost, that gain will only show up as a change in the composition of spending, instead of as a decline in the quality-adjusted price of accomplishing the underlying task. This could lead to overestimating inflation and underestimating real output.
Finally, AI could shift spending toward more error-prone sectors (services). Even if AI doesn’t increase measurement error in any sector, it could lead people to spend a larger share of their income on (poorly-measured) services rather than (well-measured) goods. This shift in expenditure weights would raise aggregate measurement error in the aggregate.
This argument has been pretty abstract so far. So let’s take a couple of examples of specific cases where AI’s contribution to GDP might be difficult to measure, or easily miscounted under the current system.
Education
Government outputs, like public K-12 education, are measured differently from most of the economy. Because there aren’t consumers paying market prices for the good, there’s no price or quantity of output to observe. Instead, the statistical agencies define government “production” as the cost of the inputs – mostly employee compensation – and compute real output by deflating each input with its own price index. Real government output, in other words, just tracks real government inputs. This builds in an assumption of zero productivity growth: by construction, the government can never produce more education per teacher-hour, since all that they’re measuring is teacher-hours.
This could lead to education quality measurement becoming way worse with AI. Imagine more public schools follow the precedent set by schools like Alpha School and use AI-guided lessons for the majority of instruction. This could cut down on the number of teacher hours, by requiring students to be in school for fewer hours a day and reducing the number of instructors you need per student. It could also increase the quality of education, since AI-guided lessons allow for better tailoring to each student. This would improve the production of high-quality education while allowing the government to spend less on inputs. But because measured output is inputs, GDP would record this as a decline in the production of education. A large productivity improvement would show up in the national accounts as lower GDP.2
Conversely, AI could reduce student learning per teacher-hour if, for example, it made it easier for students to cheat on assessments without learning. Either way, this example shows how accounting for quality changes in education could dramatically change our estimates of how much education we are actually getting per dollar spent.
Tax preparation
Tax preparation by an accountant costs a few hundred dollars. By contrast, an AI that prepares tax returns costs a few dollars worth of tokens, and it might do the job better (if, say, it makes fewer errors than the average accountant, or can access a broader database of eligible deductions).
The CPI estimates the cost of tax return preparation using the matched-model approach, meaning it tracks what accountants charge without attempting any quality adjustment. In this scenario, where lots of people switch to AI accountants, accountants’ posted prices won’t fall just because AI exists (if anything, they might rise, if, say, the remaining clients are more complicated or the remaining accountants offer fancier services). In this case, the effective price of preparing a tax return falls significantly – but the index for tax preparation would record no price decrease, and could even show a price increase. Instead, the money that is now being spent on an AI subscription will get counted in a software or internet services category, whose price index is not designed to reflect that the product is replacing a human accountant.
As a result, we never record the price decline for accounting services – so inflation will be overestimated, and real GDP growth will be underestimated.
This logic is not unique to tax preparation – it applies to any other professional service that people will use AI for, like legal consultations, medical advice, or home improvement advice.
Other concerns about AI and GDP measurement are less relevant
Other people have written about difficulties with measuring AI’s contribution to GDP. However, we think most of the relevant ways in which AI could make GDP difficult to measure are in fact inflation adjustment difficulties, and non-inflation concerns are largely insignificant. For example:
Moving work inside a firm: Some analyses have claimed that moving a task inside a firm causes its value to disappear from GDP. SemiAnalysis gives the example of a firm replacing a $10,000 outside HR service with $10 of AI tokens and argues that GDP consequently falls by $9,990. But this is not how intermediate goods are counted.3 To avoid double counting intermediate goods, GDP subtracts out intermediate inputs by measuring value-add (final value minus intermediate inputs). In the version of the SemiAnalysis example where the HR service is outsourced, GDP would measure the final value of whatever the firm makes minus the 10,000 paid to the HR firm, and then measure the 10,000 of value produced by the HR firm minus whatever the HR firm’s inputs were. In the version where the HR service is in-housed due to AI, $10,000 is no longer subtracted out of the firm’s value-add, and $10,000 is no longer added in for the HR firm’s value-add. The net effect on GDP is zero.
Sector misattribution: This is an actual issue – as we discuss above, AI activity might get recorded in different sectors from the service it’s providing. However, this is not an issue for total nominal GDP. The error only comes in when trying to calculate real GDP, because it deflates nominal GDP by the wrong sector’s price index (e.g., when an accounting service migrates into software, neither category’s price index captures the fall in the cost of preparing a tax return).
Declining cost of services leading to “dark output”: The cost of certain services (like drafting a legal document) has fallen dramatically due to AI. Some analyses, including the same SemiAnalysis piece, have claimed that this means that those outputs will effectively no longer be counted in GDP. This is only true if you have inaccurate deflators! In theory, an accurate deflator should capture the declining cost of producing the service, and deflate nominal output accordingly. In practice (as noted above), it’s certainly not guaranteed that we will have sufficient deflators, but it’s important to emphasize that the only reason the declining cost of services will be an issue is because of inflation adjustment.
New AI-generated work not being captured: SemiAnalysis also gives the example of an AI literature review that now costs $2 but would previously have cost $2,000, arguing that the many new literature reviews people generate will be mostly uncounted in GDP. But this is another inflation-adjustment problem. A good inflation measure would record the huge decline in the quality-adjusted price of producing literature reviews. As people produced more reviews, dividing their spending by that lower price index would show a correspondingly large increase in real output. It’s entirely true that GDP wouldn’t capture the additional consumer surplus – the difference between what users would have been willing to pay and the $2 they actually paid. But GDP has never attempted to measure consumer surplus! GDP is only about measuring the amount of stuff produced. AI might widen the gap between GDP and welfare, but any failure to capture the increase in market output would still arise mainly from an inadequate deflator.
“Ghost GDP”: Citrini Research’s article on “Ghost GDP” describes a scenario where AI-generated output continues to appear in GDP but “never circulates through the real economy,” because wages go down and spending declines. The accounting on this doesn’t make sense: every dollar of measured GDP corresponds to a dollar of income earned.4 If AI reduces compensation while increasing corporate profits, income has just shifted from labor to capital, but it’s still being counted. This might not be a good outcome – concentrating income among capital owners could reduce consumption and increase inequality. But if consumption fell without an offsetting increase in investment, government spending, or net exports, actual GDP would fall as well.
Failure to count fabless chipmakers: Epoch AI published a report arguing that because of quirks in how GDP is calculated, the majority of the value created by fabless chipmakers like Nvidia is excluded, leading GDP growth to being underestimated by 0.3 pp. Unlike most issues we have talked about, this is a problem with measuring nominal GDP rather than real GDP. This is a live and complex issue, but it is only incidentally related to AI because of semiconductors’ role in the AI supply chain, and is not likely to represent issues with counting AI’s economic impacts more broadly. (Of course, even an Nvidia-specific issue can have sizable impacts on GDP measurement if Nvidia grows dramatically; our point is simply that this is not an AI phenomenon.)
What do we do about it?
While AI might make the inflation-measurement problem especially bad, it largely does so in familiar ways. This means that incremental improvements to existing methodologies of the statistical agencies would go a long way towards addressing this problem. Some examples:
Measure government output directly, like the UK does. After a 2005 review, the UK’s Office for National Statistics moved from measuring government inputs to measuring outputs directly. In education, for example, the UK measures cost-weighted pupil numbers, quality-adjusted using attainment data from GCSE test scores. This can be more labor-intensive to estimate, but it directly fixes the problem in the education example above: an AI-driven productivity improvement in schools would register as an output increase rather than a spending decrease.
Speed up sample rotation and substitution. Starting in 2018, BLS began updating the estimates for smartphone quality twice a year because of how frequently quality improvements came out. Extending this precedent to more AI-affected categories would shrink the lag through which quality change makes its way into measured inflation.
Use alternative data. BLS has been moving categories from field-collected prices to web-scraped and scanner data with hedonic models re-estimated every month – for example, price collection for wireless telephone services now works this way. Scraped data makes it feasible to track quality characteristics at scale, which would be useful for keeping track of fast-changing AI products.
That being said, there are probably some ways in which AI causes novel problems that old proposals don’t address. Sector attribution is probably the most significant: no amount of improving the deflator within each category helps if spending is migrating across categories in ways that sever the link between what people buy and what the deflator “thinks” they are buying. The following are two tentative ideas for addressing some of the AI specific issues.
First, create a separate category for AI. Statistical agencies sometimes create new categories when an emerging product becomes economically important. During its 1998 restructuring, for example, BLS created distinct categories for newly-significant products like computer software and cell phones. A separate AI-services category would make it clear what share of production is attributable to AI (as opposed to other software categories). More importantly, it would also give AI its own expenditure weight and price index.
AI could be quality-adjusted using model benchmarks, like the Epoch Capabilities Index or the METR Time Horizon. Statistical agencies could treat benchmark scores, as well as other features like latency and context length, as product characteristics in a hedonic model, allowing them to estimate how much the price of a constant level of AI capability is changing. That all being said, we’ll note that establishing a consistent measure of quality is much easier said than done, since it’s difficult to standardize measures of intelligence in a way that reflects real-world value.5 Benchmarks can also saturate or be gamed. Nonetheless, using benchmarks as an input to adjust for quality could still provide considerably more information than an unadjusted subscription price.
Second, make task-based price indexes. A more direct way to address sector-attribution errors would be to organize supplementary price indexes around the task being completed rather than the product being purchased. A tax-preparation index, for example, could treat an accountant, conventional tax software, and an AI subscription as alternative ways of producing the same output (a completed tax return meeting a specified accuracy and compliance standard). If consumers switched from a $300 accountant to a $20 AI service, the index could record a decline in the price of preparing a tax return, even though the spending had moved from professional services into software.
BEA could initially publish these indexes in a “satellite account”: a set of supplemental statistics that experiments with a different way of organizing economic activity without immediately changing headline GDP. There is some precedent for this in BEA’s Health Care Satellite Account, which measures spending by the disease being treated (like heart attacks) instead of by the type of spending (e.g. doctors visits or hospital visits). This allows it to capture changes in the cost of treating a condition when patients switch between different types of spending.
A satellite account could eventually feed into the main statistics. BEA first measured R&D investment experimentally before incorporating it into official GDP in 2013. If task-based indexes revealed a large and persistent measurement error, BEA could similarly use them in the detailed price measures that feed into PCE and GDP. Declines in the cost of completing AI-exposed tasks would then show up as lower inflation and higher real output in the official accounts.
For a few items, like wireless phone service, BLS goes further and computes the index directly from a hedonic model re-estimated every month, rather than only invoking the model at substitutions.
As an aside, the non-market nature of government output means that it is a sector in which AI could lead to mismeasurement of nominal GDP in addition to real GDP. In this example, the fall in teacher-hours also shows up as a decline in nominal GDP. However, this is largely unique to government spending; in most of the economy, nominal GDP remains accurately measured.
Indeed, if GDP were counted the way the SemiAnalysis example implies, it would mean that GDP was massively overestimated, because it would be double counting loads of intermediate goods.
GDP and gross domestic income (GDI) can differ numerically, but this is only because of differences in data construction.
There are already some existing attempts to adjust the price of AI services for quality, like the OECD’s quality-adjusted price index for language models. However, these are subject to the same issues, where it’s difficult to standardize quality in a non-arbitrary way.